

Candlestick reversal signals are some of the most powerful and abundant signals used by price action traders – the most common of them being ‘The Pin Bar’.
Pin bar trading is generally the backbone of most price action trading systems used in today’s Forex markets.
I work with a different flavor of pin bar, which I call a Rejection candle – which provides more trading opportunities, and a more up to date, modernized view of the reversal pattern.
First, let me talk about the classic pin bar, then move on to explain how the Rejection Candle is different, and better.
The Anatomy of a Pin Bar Candlestick
The Pin Bar candlestick is made up of from a specific layout of the following 3 important focal points…
- The open price
- The close price
- The nose or candle wick
The open and closing prices are pretty self explanatory; If you don’t know how read charts yet, please just out the following chapter – Understanding Japanese Candlesticks.
The most characteristic feature of the pin bar the ‘nose’. Pin bars have a long nose (aka candle wick) which protrudes out of one side of the candle body.
To qualify as a pin bar, the open and close must be situated at one end of the bar’s range, and the nose of the bar must make up at least 2/3’s of the whole bar’s range. The general rule of thumb is – the longer the nose of the pin bar, the more powerful the pin bar signal.

A Little History About The Pin Bar

If you remember the childhood stories – Pinocchio was a wooden doll that was brought to life by his creator, and every time Pinocchio told a lie, his nose would grow larger.
The analogy of Pinocchio tied in perfectly with Martin’s observations, because a pin bar is broken down into 2 moves.
The first par of a pin bars formation occurs when price moves from position X to position Y. Position X isn’t generally anywhere important, but position Y could be a strong technical point on the chart, like a support or resistance level, a weekly turning point or even another focus point.
This initial move draws in the ‘trigger happy breakout traders’, who love to jump in with the price momentum. Sometimes the X -> Y price move may even give the illusion that a major breakout is occurring.
Phase 2 of the pin bar creation happens when this initial X -> Y movement is not really the markets true intent, the charts were ‘telling a lie’. Price then springs back from position Y to somewhere near its original position X.
Just like Pinocchio, the bar grows a big nose as the ‘lie’ is revealed on the charts – trapping those breakout traders into bad positions.
[clear]
Take a look at the bar chart below. You can see the two phases of price movements which are responsible for printing the pin bar on the chart.

How Pin Bars are Used in Trading
Pin Bars are one of the most powerful tools a trader can have in their price action arsenal. They form very regularly and can be found across all time frames. The pin bar’s core purpose to help the trader identify potential reversals in the market. When pin bars form, it is a good sign the market is ready to move in the opposite direction.
Price action always tells a story. The story of a pin bar is is one where price moved to an area on the chart. The move is rejected by the market, and pushes price back to its original point of origin. Sometimes even beyond if it’s a good signal. Working with the logic of the rejection principle of pin bars, we can use them to:
- Capture potential tops and bottoms to price movements
- Identify breakout traps that can lead to powerful price reversal moves
- Position into trending environments at excellent prices.
Rejection Candles
When Pring first named the Pin bar – the majority of traders were using bar charts. These days traders prefer candlestick charts because they are easier to read, and are more aesthetically pleasing. The candlestick equivalent of a pin bar can carry many names – but here at The Forex Guy we call them ‘Rejection Candles’.

Pin bars and Rejection candles are almost identical in nature. But traders tend to use the term ‘pin bar’ when referring to candlestick charts, which is technically not correct. It also doesn’t sit will since I am OCD about getting things right 🙂 I don’t like to call a white cat black, and I try not to call a candlestick signal a ‘bar’.
I call the ‘rejection’ part of the candle the ‘wick’ or the ‘tail’ of the candlestick. A Rejection Candle will have a large wick just like it’s cousin – the Pin Bar’s.

For a candlestick to qualify as a Rejection Candle it must have the following attributes.
- The open and close price of the candlestick must be situated at one end of the candle (not in the middle)
- The wick of the candle must protrude out of one end of the candle body. There must not be any large wicks sticking out both ends of the body.
- The wick must make up at least 2/3’s of the entire candle length. Clause: If the wick is less than 2/3’s of the candles range, then the closing price must be either be higher than the opening price for a bullish signal, and lower than the opening price for a bearish signal. This is what makes the rejection candle’s anatomy differ from the pin bar – they can have thick or thin bodies.
Depending on which way the wick or nose produces from the Rejection Candle (or Pin bar signal), will determine whether it’s a bullish or bearish signal. I like to think of the signal as an arrow on the chart. Imagine the body of the candle is the arrow head. The wick or nose is the arrow body and the arrow points towards where price wants to go.
Here is an example of how a bullish Rejection candle points towards higher prices.

Notice the bearish rejection in the chart below. See how the wick of the candle protrudes upwards creating that imaginary downward pointing arrow, signalling price wants to move that way.

Identifying High Probability Trades Using Rejection Candles
Rejection candles, or Pin bars, form quite often across all the time frames – but that doesn’t mean all rejection candles are ideal trading signals. If you traded every single Rejection candle you would most certainly end up losing money – so it is very important to narrow down the signals that have a higher probability of working out in your favor.
To quickly improve our chances of success we trade Rejection Candles mostly from the Daily time frame (sometimes the 4 hour). Anything lower than the 4 hour time frame significantly reduces the quality of the signals. By sticking with the higher time frames we can immediately improve our odds of success – and that really goes for most Forex trading strategies.
To further improve the effectiveness of rejection candle trading, it’s best to trade rejection candles that form at important support and resistance levels on the daily chart.
Important support and resistance levels dominant on the daily, or weekly time frame are generally the key turning points for price in the market, especially those from the weekly time frame. Combining these important levels with Rejection Candle or Pin bar signals, you exponentially improve your chances for a successful trade. The odds are in your favor simply because market history repeats itself. If you study pin bars and rejection candles in your Forex historical data – you will see they continuously produce the same response from the market.
A bullish rejection candle forms off an important support level – signaling to price action traders that higher prices are likely to develop in the near term.

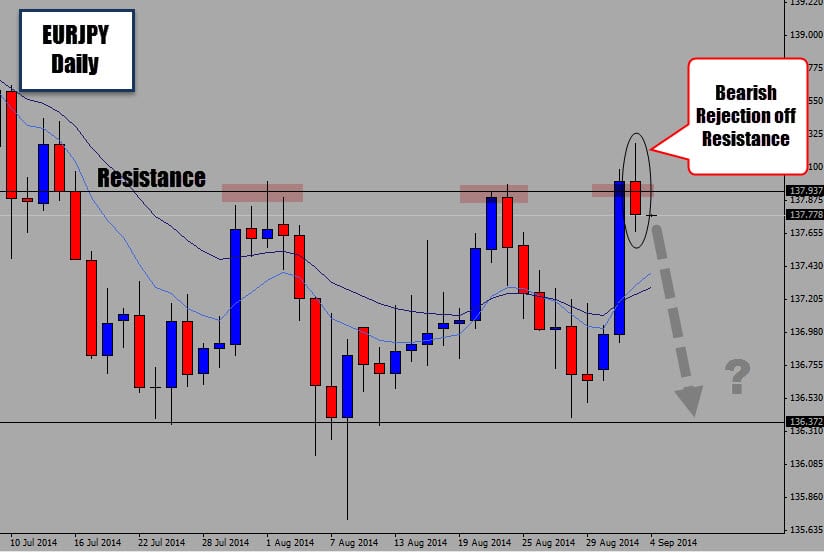
A bearish Rejection Candle forms at an important resistance, tipping traders off to bearish movement before it happens.

Here is an example of how Rejection Candle signals can be great reversal signals in ranging markets…

Here is another example of another ‘thick bodied’ bearish rejection candle range setup that was discussed in the War Room…
Notice how the rejection candle had a thick bearish body it to, unlike the common pin bar which only had a small range it its body. These thick bodies give the signal a little bit more ‘oomph’ and tend to work out much better. Check out what happened next…
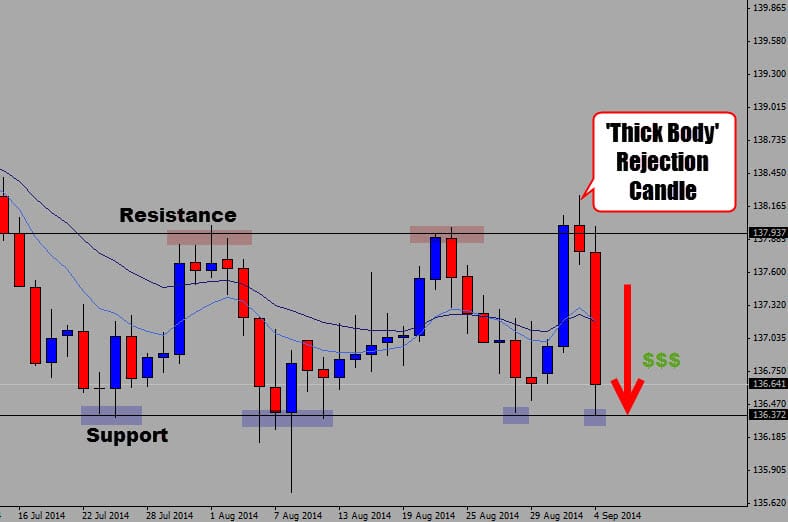
As you can see this rejection candle was able to give a price action trader the early warning sign needed to position into a bearish trade BEFORE the actual sell off occurred. This is a good example of how powerful price action trading really is.
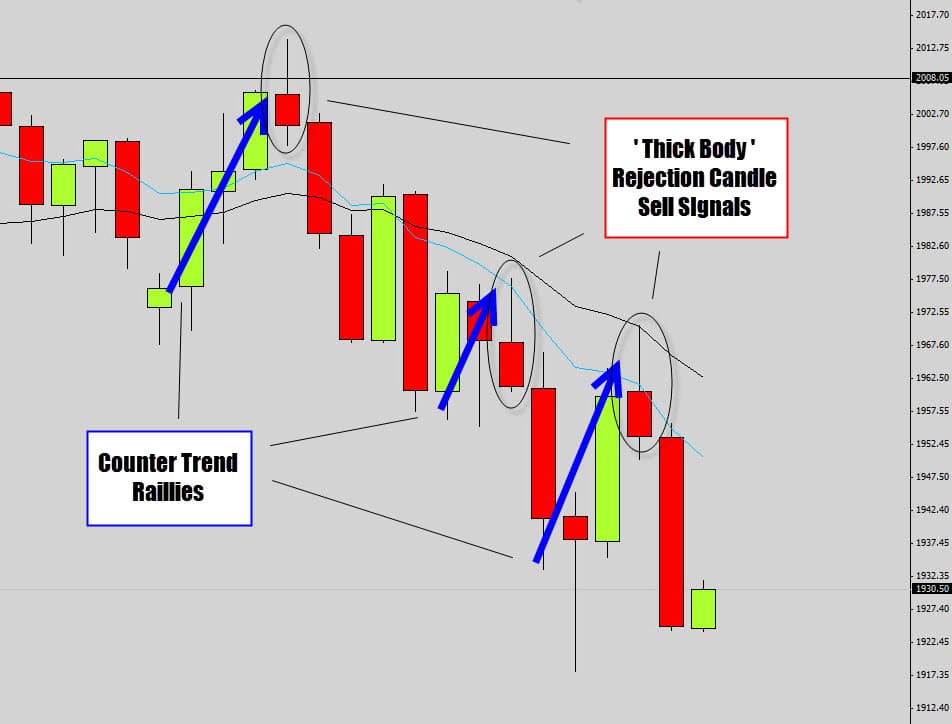
Trading Rejection Candles Inside Trending Markets
Rejection candles also work great in trending conditions as well. I know we said they are ‘reversal’ signals but if you think about it, reversals occur with in a trend. Rejection candles are very good leading indicators to let price action traders know when a counter trend movement has terminated. These counter trend moves push prices into what we call ‘hot spots’ where the price is right for positioning into a trend.
“Buy the dips and sell the rallies” – Have you heard this saying before?
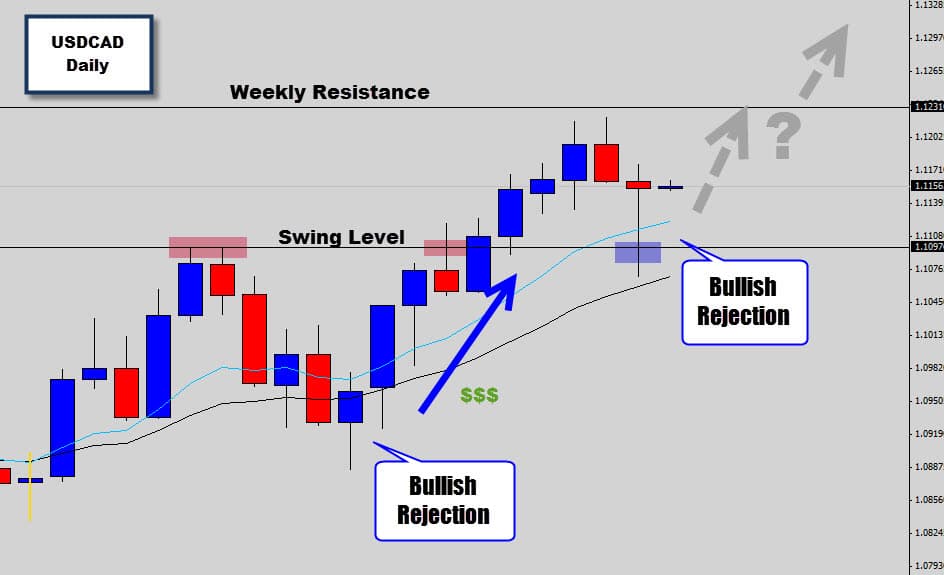
Rejection candles that form at the dips and peaks within trends can offer very lucrative trading opportunities…
Check out the chart below. The USDCAD has printed a bullish rejection candle. Can you guess where this market might be heading???
Video: live rejection candle trade I took on the EURNZD daily chart…
[iframe style=”width:100%; height:372px;” src=”//www.youtube.com/embed/KmW7myZJmu4″ frameborder=”0″ ]
To Summarize
It’s very easy to see why Rejection Candles and Pin Bars have become one of the most popular tools used by price action traders in today’s markets.
Rejection Candles are very powerful candlestick signals, and coupled with the right money management plan you can really do well. Rejection Candles produce excellent returns for price action trader, tip us off to moves before they happen and give us the framework to build a logical trade position from.
Rejection candles (and even pin bars) are easy to identify – they don’t take much effort at all to spot a great trading opportunity, especially when used with our Forex trading strategies.
If you would like to continue learning everything there is to know about Rejection Candles like; rejection candle entry strategies, stop loss placement, money management for rejection candles and even filtering out good vs bar rejection candle trade signals – the Price Action Protocol trading course inside our Forex Price Action War Room is going to be a -perfect- fit for you.