
- The Anatomy of Renko Candles
- Comparing Renko to Regular Candlesticks
- The Art of Non-Time Based Charting
- How do Renko Candles Form?
- How to Get Renko Charts on MT4?
Today, I would like to introduce you to a very unique type of charting format, an ‘out of the box’ idea – so simple, you would probably say to yourself, “now why didn’t I think about that?”
The concept was brought to us by the Japanese – no surprise there. You probably already know the Japanese invented the candlestick chart. However, they also invented many other type of awesome charting formats – including Renko candles.
Seriously, where would we be today without their historical contributions to financial analysis? Doumo arigatou gozaimasu guys.
Renko is derived from the Japanese word “Renga” – which translates to “brick”. You will soon discover the name is very fitting.
What I love about this chart format, is that it’s simple in nature, and most of you will know that keeping trading as simple as possible is one of the best trading philosophies to adopt. For this reason I’ve been a big fan, following Renko charts casually for the last 5 or so years.
In this lesson, I would like to introduce you to Renko candles, explain how they work, and show you how Renko price action can be a very powerful way of looking at the markets.
The Anatomy of a Renko Candle
There are a few different flavors of Renko candles out there, today I am going to focus on the original versions.
Most scripts, or charting platforms that do offer the Renko format, will generate Renko Bricks only. The brick section of the Renko anatomy is basically the body – offering only two points of data, the open and close price.
Here is an example of a Renko ‘brick only’ chart that is generated by an MT5 script.
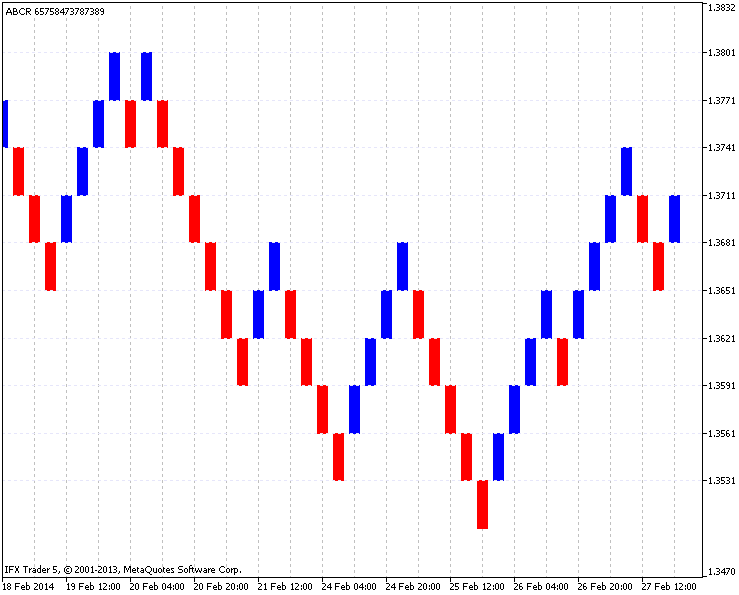
Renko bricks do look nice and clean, and at first glace look like the holy grail.
A lot of traders will tell you that Renko bricks are the best, because they cut through all the market noise – which is somewhat true, but deceptive at the same time. You’re missing out on 50% of the information – almost ‘flying blind’ having no true indication of where price has been.
For this reason, I much prefer Renko candlesticks.
The candlestick versions are identical to normal candlesticks in regards to their anatomy – both provide an open, close, high, and low price.
Therefore no information is hidden away, Renko candles give you a true representation of the price action. That’s excellent, because us traders want to know the ‘complete picture’ – not half the story.
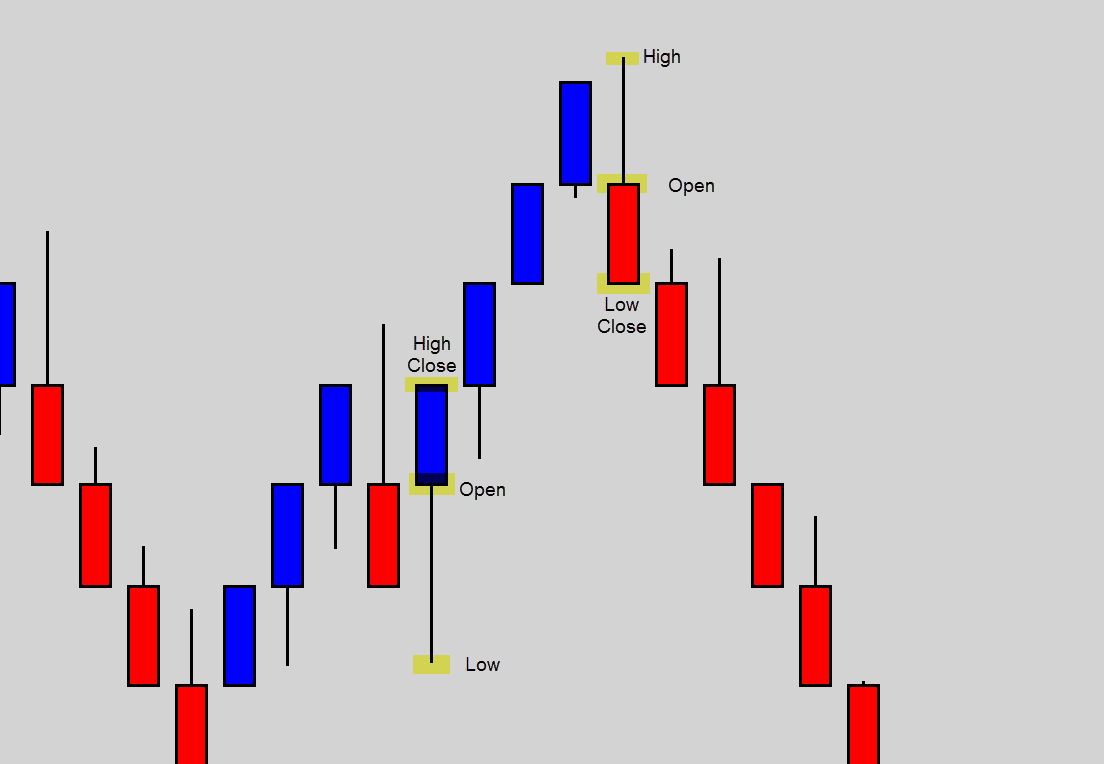
Due to the nature of the candlestick version, 2 data points will always meet. When you see a bearish brick, the close price will be the same as the low price. For a bullish brick, the close price will be the same as the high price.
Checkpoint
There are two main variants of Renko charts – ‘brick only’ or ‘full ranged candlesticks’. If you use ‘bricks only’, you won’t really know where price has been before new bricks are created, putting your technical analysis at a disadvantage – especially when considering stop placements. You’re much better off opting in for the candlestick versions, so you get the complete price action data.
Comparing Renko to Regular Candlesticks
More and more investors are equipping their arsenals with these ‘timeless’ charts.
Traders are attracted to their ability to filter out market noise, and provide a better representation of the overall market structure. In other words, they are easier on the eye and it makes chart reading much more pleasant.
This type of ‘no time limit’ price action makes it is very easy to spot: trends, ranges, and the classic market patterns – like the double top or bottom. Traders also find it a much easier way to identify support and resistance levels, because turning points on the chart are illustrated more sharply.
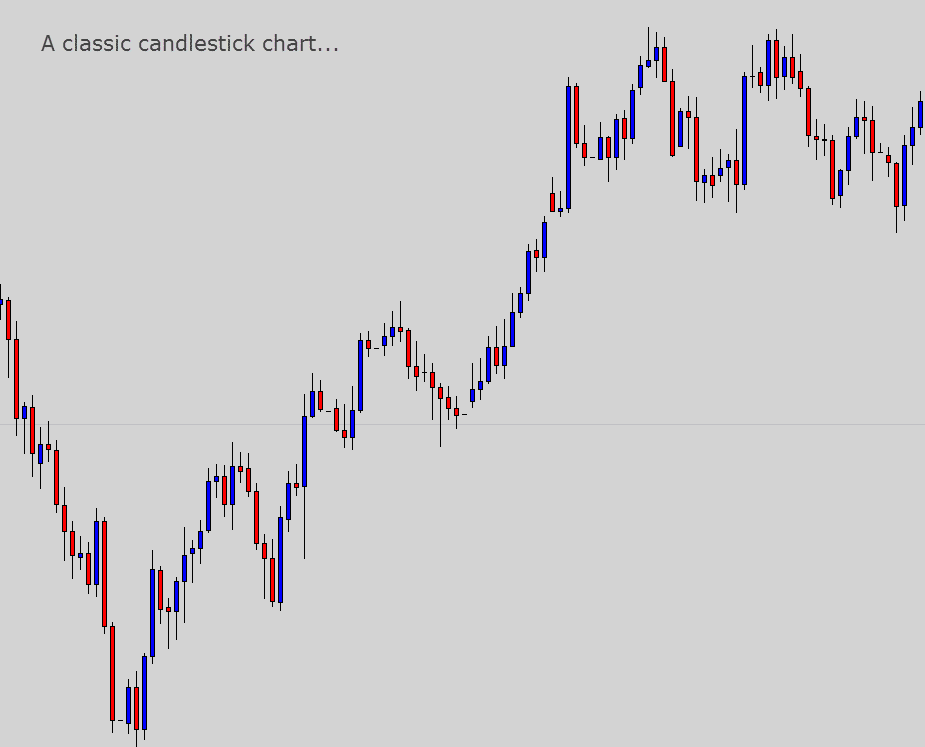
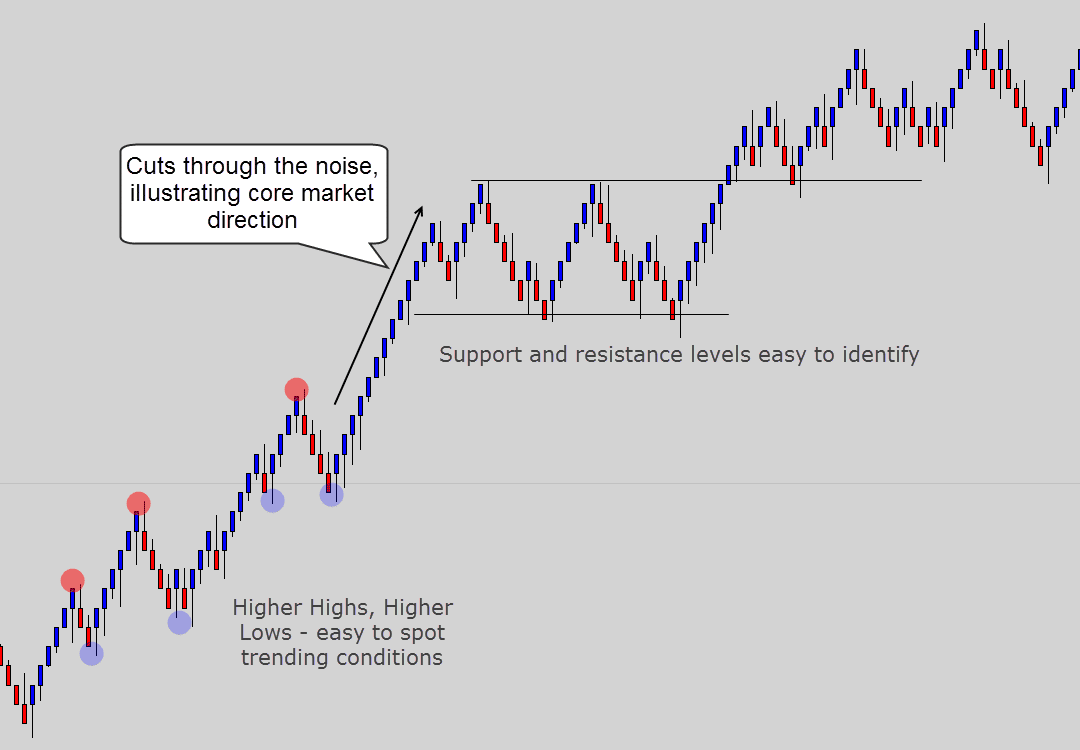
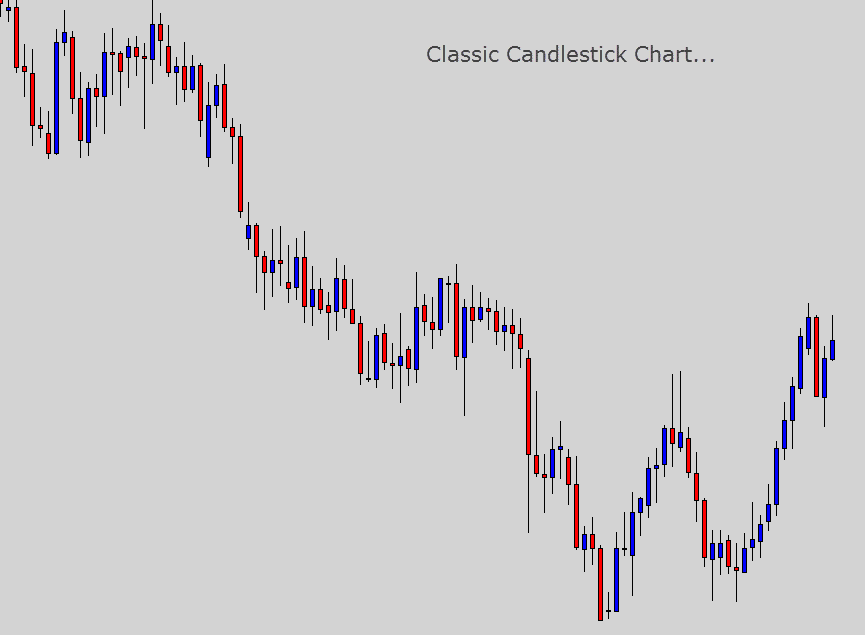
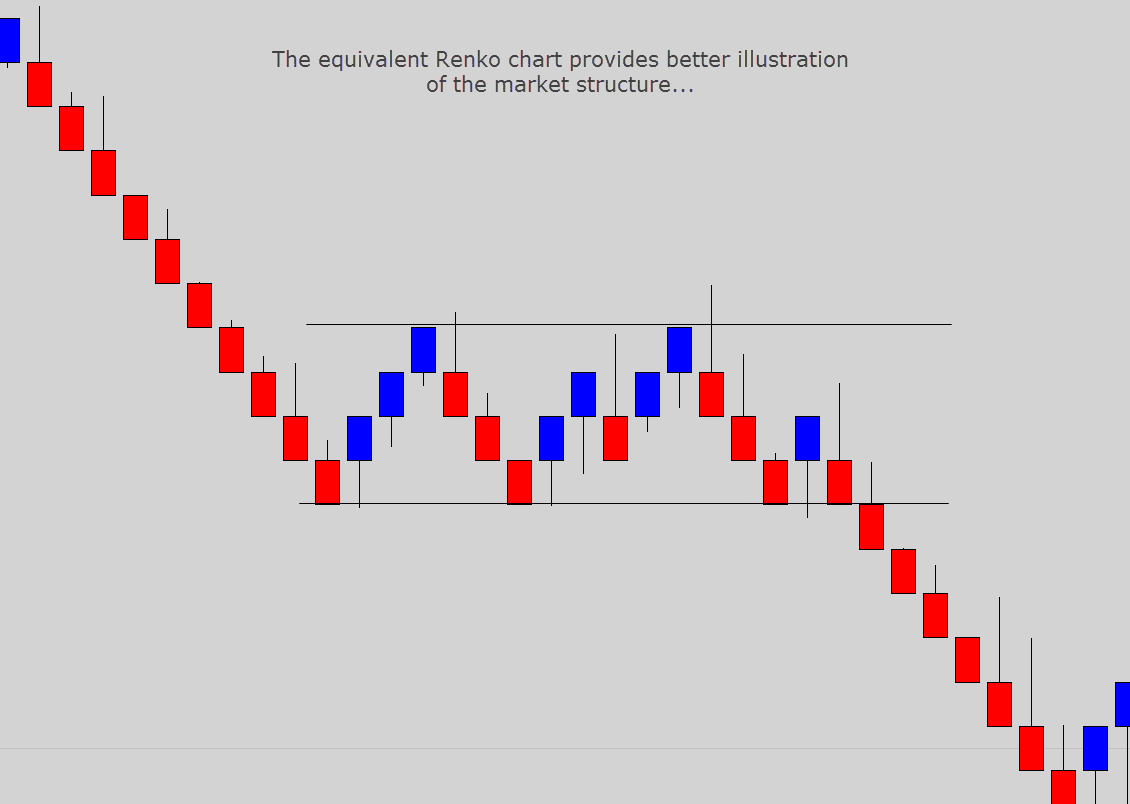
When comparing the two charts, it’s clear that the Renko charts offer a much more aesthetically pleasing way to gauge market conditions.
Check out the comparison of the two charts below…
Checkpoint
Renko charting is becoming more popular, because traders like the way Renko presents price action in a very clean, ‘noise free’ manner. Market structure becomes very easy to read, chart patterns stand out clearly, and marking support and resistance becomes a breeze.
Welcome to Non-time Based Charting
We’re conditioned to perform technical analysis with candles that open and close at predetermined time intervals, like the daily,12 hour, 8 hour, and 4 hour charts, for example.
Have you ever wondered would happen if you removed that time based rule? That’s exactly how you create a Renko chart.
Renko is a derivative of a special charting format known as ‘range candles’ – where time is not taken into consideration for the candle closing condition. Instead, they use movement-based rules, therefore only respond to changes in price movement exclusively.
If the market goes nowhere, then no new ‘bricks’ are created. If it takes 2 weeks for the market to breakout and move, it will literally take 2 weeks before you see a new brick develop on the chart.
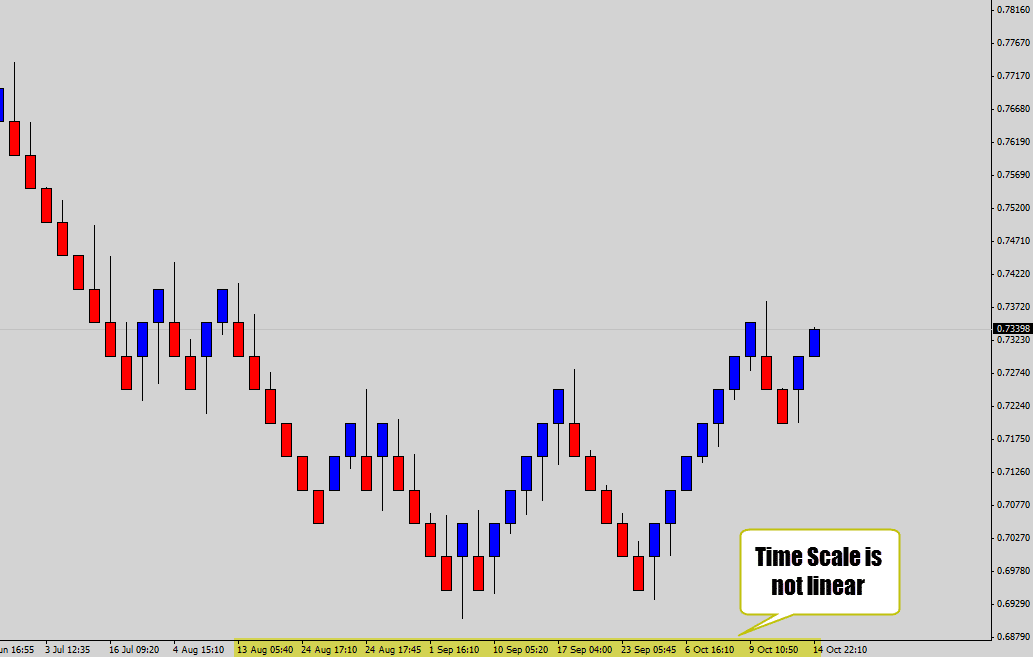
Even though ‘time’ is taken out of the equation, a time-axis will still be present at the bottom of your charts – however, it is no longer on a linear scale – the time x-axis exists now purely for reference only.
On candlestick charts, we choose what time frame we would like to view the market from. With Renko charts – we have control of the ‘brick size’ instead – which is normally set in pips.
The brick sizing will alter the way the Renko chart appears in a similar way that changing time frames does.
Smaller bricks, like 10 pips, can be compared to the short term time frames such as the 15 min – whereas larger brick sizes, like the 50 pip Renko chart, can be compared to something like the daily chart.
The larger the brick size, the smoother the chart will look. Smaller sizes will make the chart appear ‘noisy’. I personally like the 50 pip setting.
If I selected a brick size of 50 pips, then each Renko brick’s body must equal 50 pips precisely.
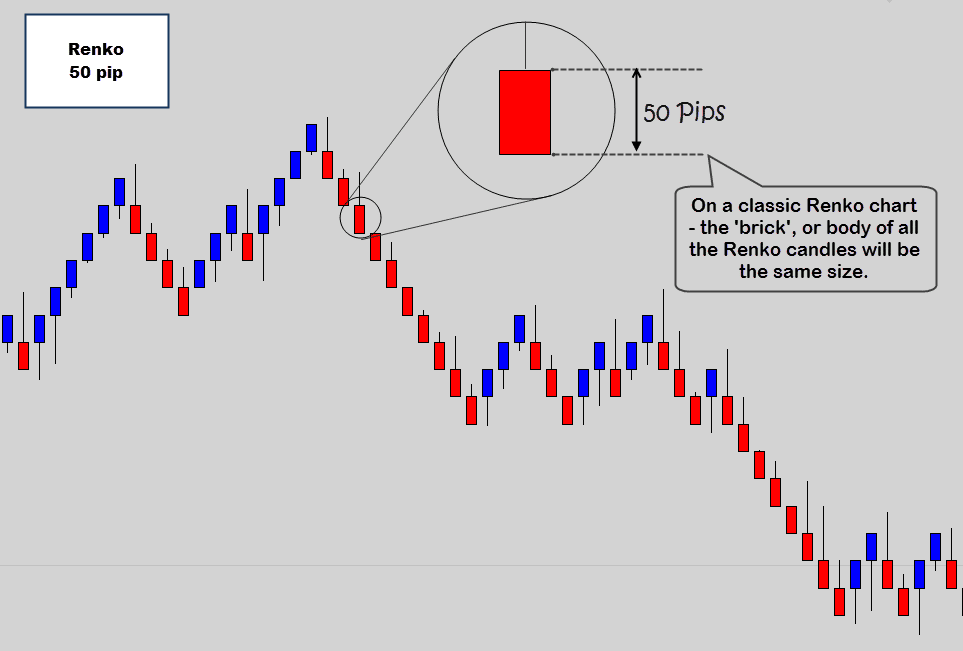
Because we’re using 50 pip brick sizing in the example chart above, every single Renko brick that forms will equal 50 pips – no exception.
Checkpoint
Renko charting is a unique way to view price action where time has been removed from the candle’s equation. A Renko candle could last 5 minutes or 5 days – depending on how fast the market is moving. Consolidating markets will see less candles generated, where trending markets will see more regular Renko candles develop.
How Does a New Renko Candle Form?
One of the most important things you need to with the Renko format is exactly how a new brick forms, and what can happen in the meantime.
Allow me to elaborate…
On a normal chart, you select what time frame you wish to view the market from. On a Renko chart, you input the brick size you would like the Renko bodies to have. The script, or software you’re using to make Renko charts will provide this option.
I am going to continue using my favorite brick size of 50 pips as an example.
Observe the illustration below…
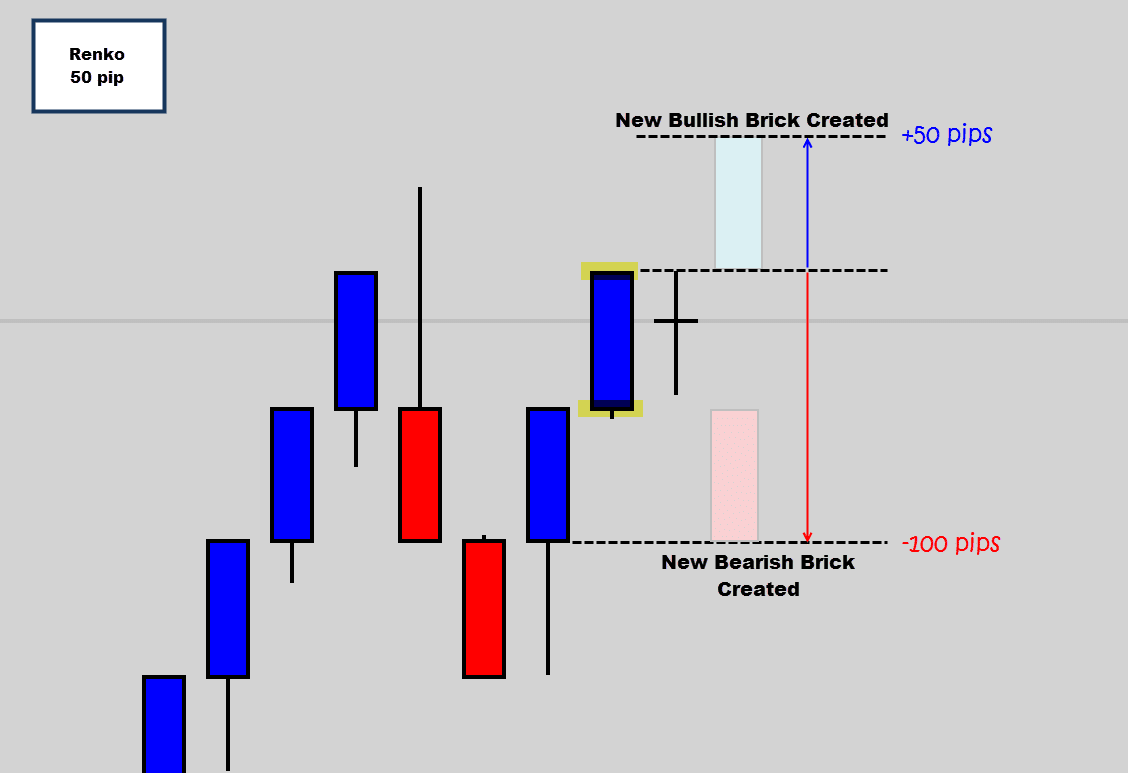
The diagram above will show the conditions required for a new brick to form.
Because the previous Renko brick was bullish, the market only needs to move another 50 pips higher to create the next bullish brick.
To get an opposite to brick form, the market must travel much further. Price needs to move down 50 pips below the previous brick low – meaning it first must travel through it’s own 50 pip range. Therefore, price needs to move the distance of two Renko candle bodies to establish a direction change.
This is what most people don’t realize, and why it’s important to have Renko candles instead of just Renko bricks alone.
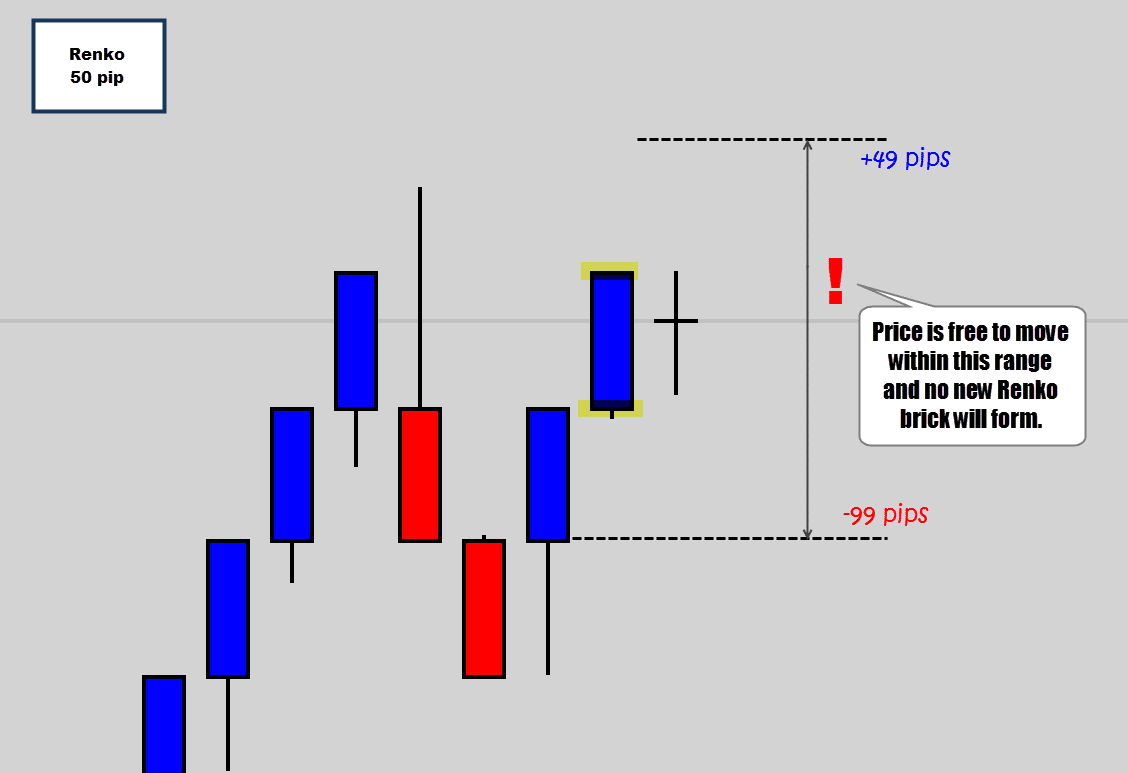
In the chart above, I’ve highlighted the full range where price is free to travel before any new Renko brick is created. This is very important information to know if you’re going to be trading these charts.
Continuing with the example shown above: A trader may choose to place their stop loss below the low of the previous Renko low, thinking that’s a safe, logical place for a bullish trade’s stop order – whereas price could move through the stop, trigger it, and then move back up high enough to create a new bullish brick.
This is how a Renko chart could deceive some traders if they don’t fully understand how they work. The trader would be stopped out, and still see a bullish brick form – even though he was long. Again, this is why the Renko candlesticks are much better – the trader would see the lower tail, and know price moved down before coming back up to create the next bullish candle.
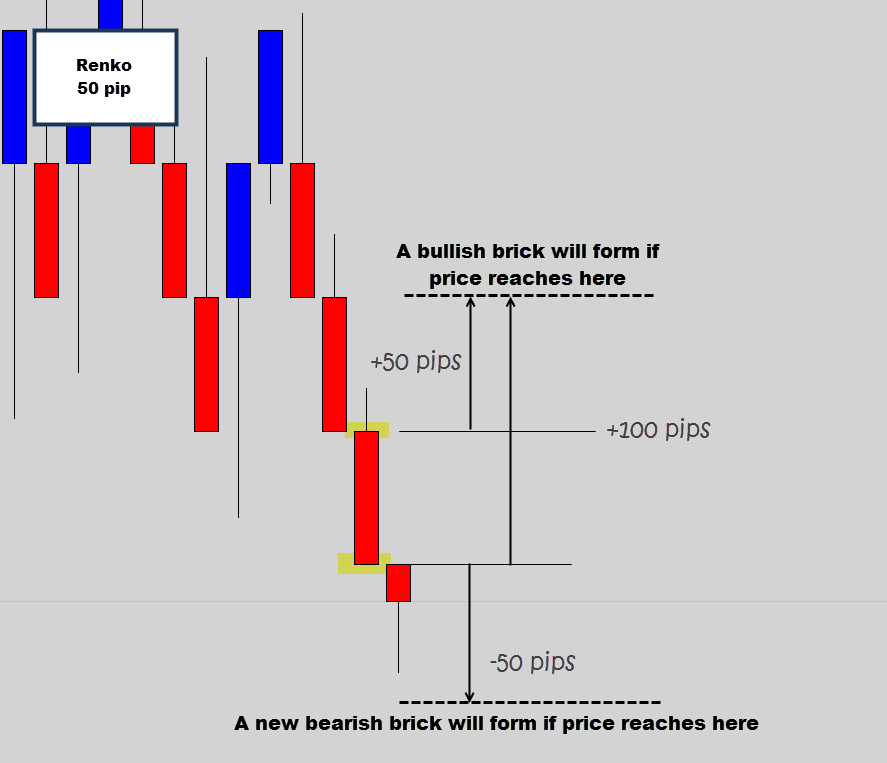
The opposite conditions are true for the reversal scenario shown in the chart below.
Now remember, no new bricks will appear until price actually touches one of those dashed lines. Take 1 pip off the top, and add one pip from the bottom barriers, and we’ve got a 148 pip range here for the market to move around in before we get any new bricks.
Notice in the example above, price has moved down to almost touch the next brick creation level – but is starting to rally back higher.
This chart could move up another 80 pips and, then fall back down to touch the new bearish brick level. That sort of price movement would leave an upper wick on the Renko candle, and would communicate extra information to the trader, who would have otherwise missed out if they were just using plain brick only charts.
Checkpoint
If you use Renko charts, it’s important to understand how new bricks form, and what can happen in the meantime. There is a large range that price can travel between before any new bricks are created – and this range extends beyond the previous Renko candle. This ‘invisible range’ is something a lot of traders are not aware of and don’t accommodate into their risk management.
How to Get Renko Charts on MT4?
Most traders use MT4, it’s considered the industry standard for Forex charting for many reasons. Unfortunately, it doesn’t support Renko candles ‘out of the box’.
Programmers can make scripts and the like which can provide work around solutions to get these unique candles on your MT4, and in fact there are many of them out there.
The problem with most of the free ones floating around forums, is they can be annoying, and messy to use. Most of these free scripts will clone a candlestick chart into a Renko chart – but the catch is you must keep the candlestick chart version open, with the program running to emulate live Renko charts.
This leads to a lot of chart clutter, a lot of unnecessary resources used, and a very cluttered work space.
If you would like to try a free version – there is one here. You will see what I mean regarding how messy it can be manage all the charts you generate.
One or two is fine, but if you need say 10 Renko charts – it means in total you will end up with 20 charts open to make that happen.
If your serious about using this format, I have designed a panel system that allows you to generate, and maintain all your Renko charts from one location.

From here, you can make as many custom charts are you like – and can even create custom candlestick charts in the same space. The panel keeps all the generated charts ‘live’, and they are compatible to use with any MT4 indicator, or robot.
To learn more about it – you can check out my MT4 custom chart generator panel information page.
I hope you walk away from this tutorial now with a full understanding on how Renko charts work, why they are becoming popular, and maybe a keen interest to give them a try.
Leave me a comment below if you’re using these charts, or if you would like to see more content regarding Renko candles on the site. Look forward to reading them.
Talk soon, and best of luck on the charts this week 🙂